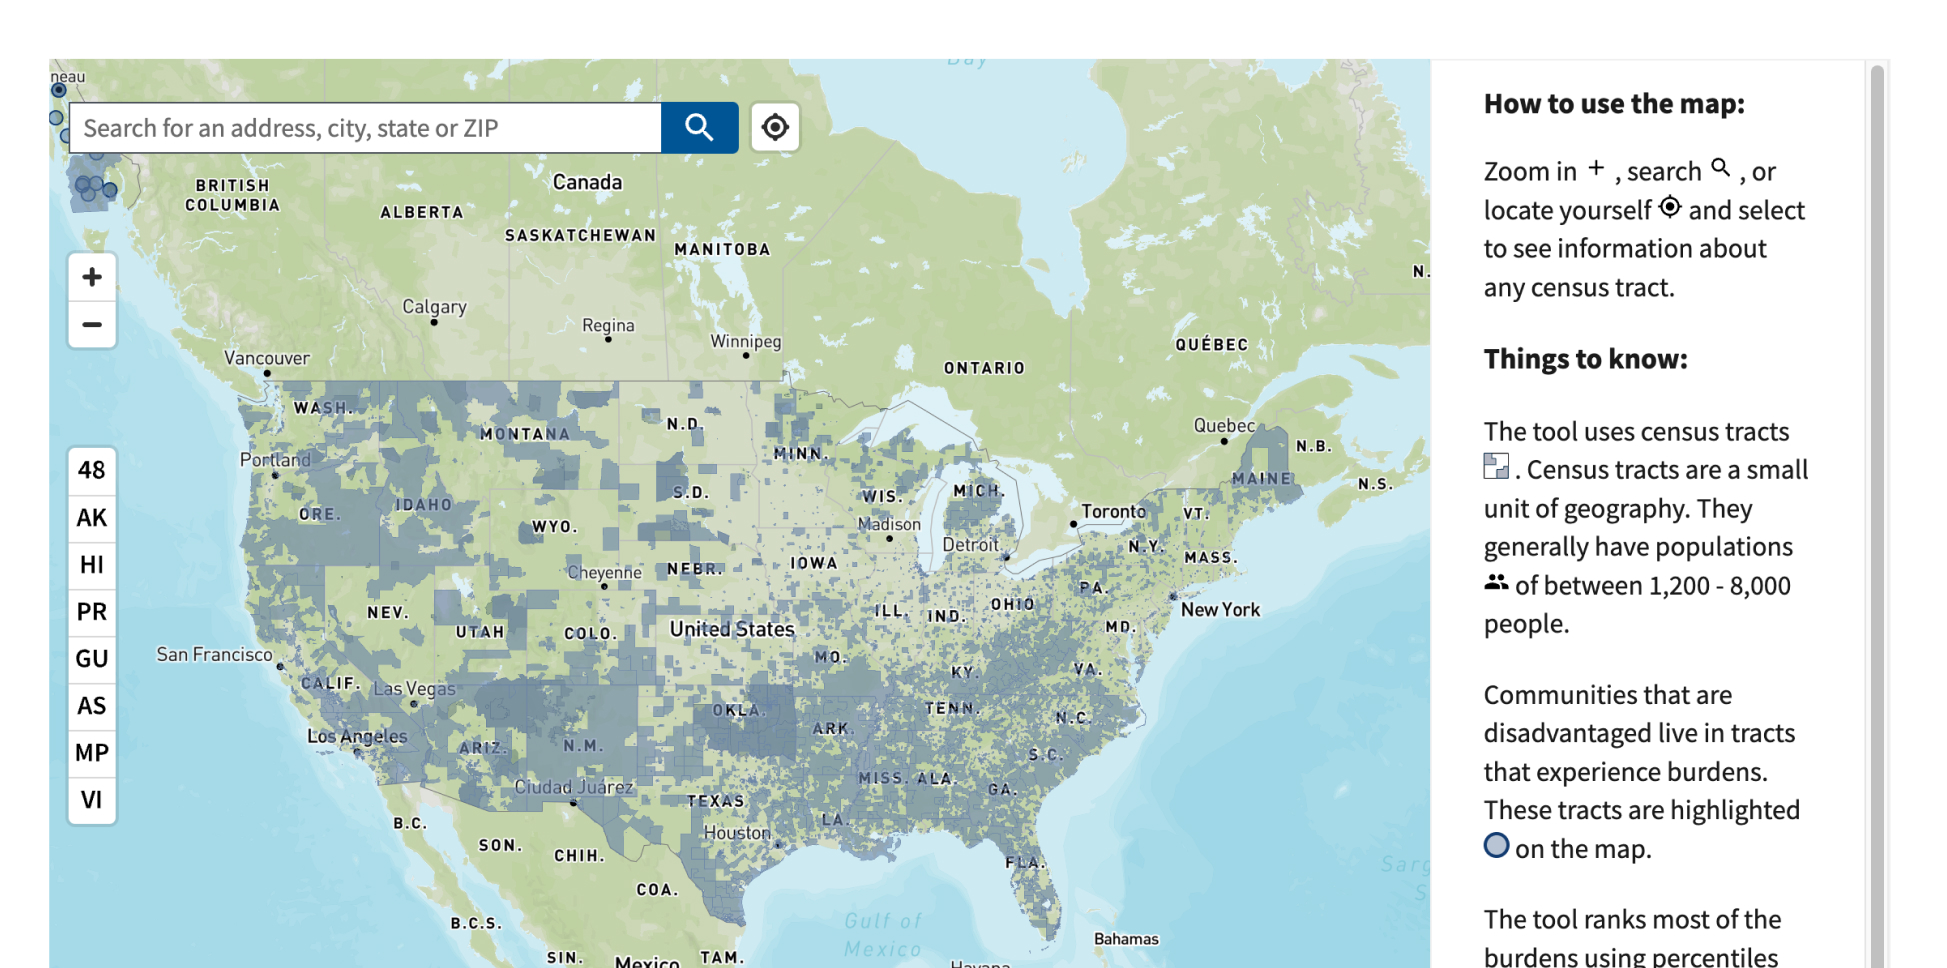
Interactive map featuring indicators of burden to identify disadvantaged communities. The categories of burden include climate change, energy, health, housing, legacy pollution, transportation, water and wastewater and workforce development.
Potential Uses
• Find associated risk for a chemical • Find demographic data related to polluted areas • Visualize distribution of pollutants and harm